30
2.19 The analysis of number of KCC issued/ outstanding vis-à-vis number of agricultural
households indicates that the KCC Scheme has made a good progress as far as
coverage of farmers is concerned, although it is difficult to estimate the actual gap
between the number of households and the number of KCC issued on account of
reliable data on both the parameters. Further, quite a good proportion of non-
KCC farmers were not very keen to avail KCC on account of various factors viz.,
their engagement in other income generating activities, their staying away from
the native village, etc.
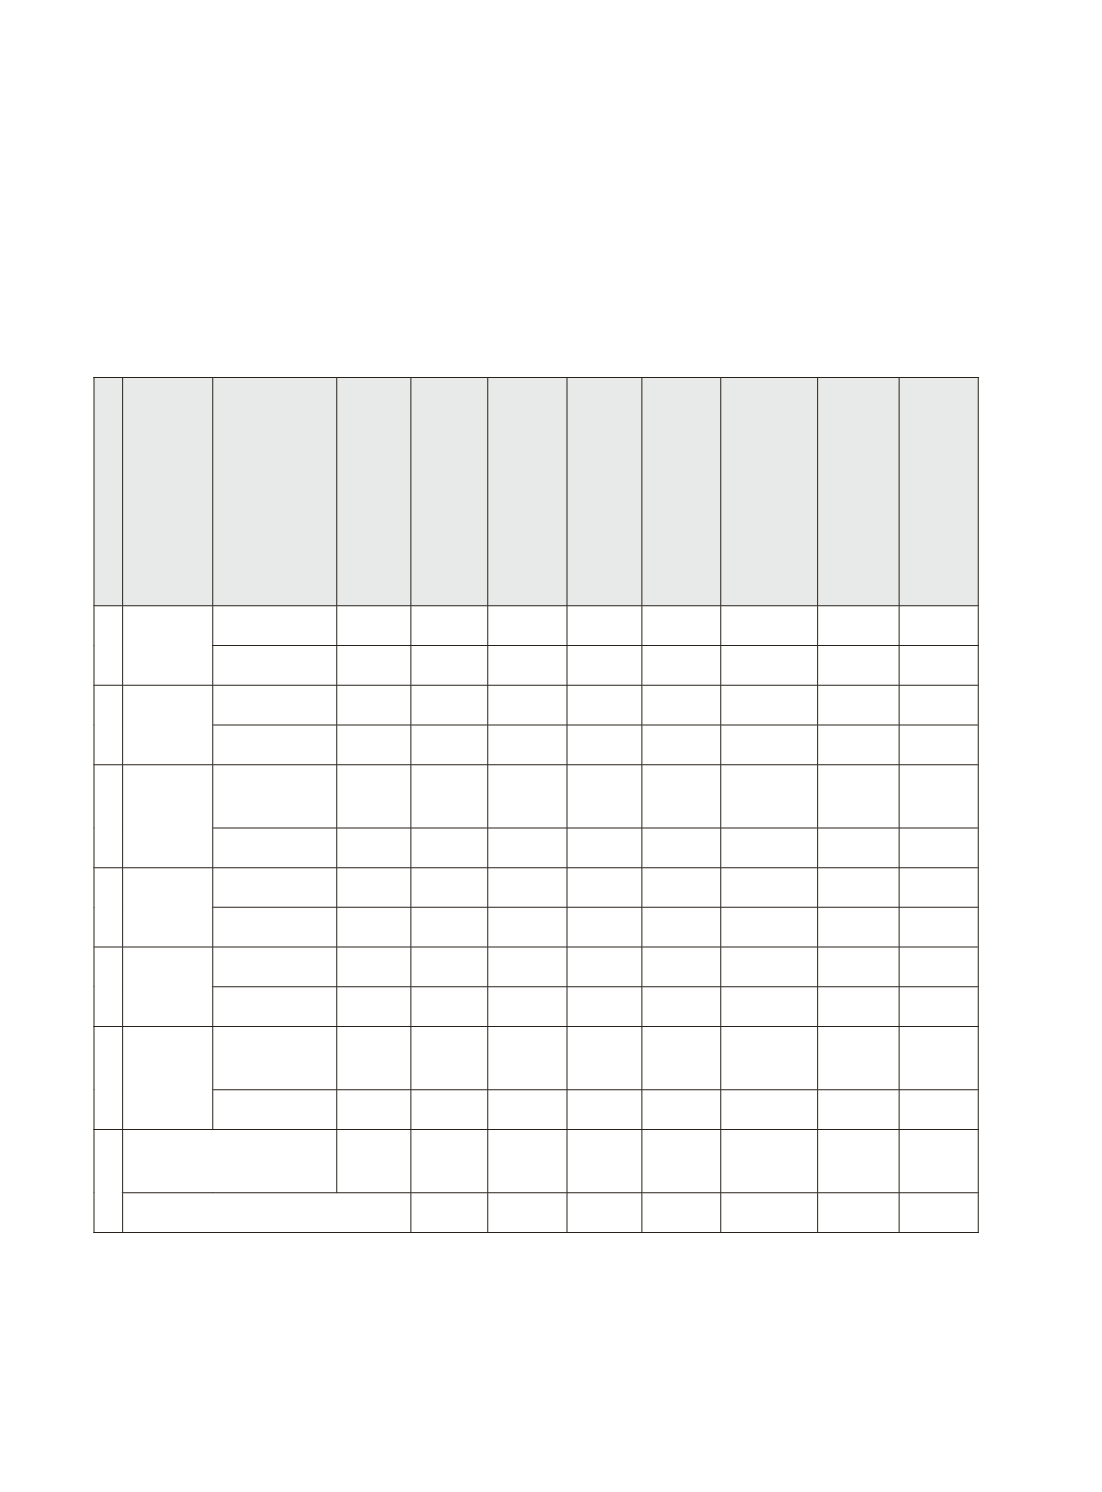
Table 2.5: General Profile of Non-KCC Farmers
States Districts
Sam-
ple
Size
SC/ ST
Farm-
ers
Aver-
age
size of
land
holding
(Ac)
No of
fami-
lies
own
tractor
Aver-
age
Family
Size
Fam-
ily go for
MNRE-
GA/ Wage
work
No of
Fami-
lies
have
income
from
live-
stock
No of
Fami-
lies
have
income
from
Service
/ busi-
ness
1
Assam
Jorhat
20
1 1.06 0
3.9
9
15
4
Darrang
25
5 2.44 4
4.9
10
13
5
2
Bihar
Gaya
17
6 1.67 0
5.2
4
7
2
Begusarai
22
5 3.23 2
5.7
2
15
4
3
U. P.
Varanasi /
Bijnaur
23
2 0.76 0
8.1
2
12
9
Moradabad 30
5 1.28 8
6.7
4
21
11
4
Punjab
Kapurthala 23
5 5.41 11 5.9
1
15
7
Bathinda 17
6 8.59 4
5.8
1
6
8
5
Maha-
rashtra
Akola
13
1 6.68 6
6.9
0
2
2
Sindhudurg 10
1 2.22 0
5.3
1
0
2
6
Karna-
taka
Dakshin
Kannada 30
2 2.31 2
4.9
3
6
10
Bellary
25
5 3.70 2
5.1
2
15
3
Total sample/ Aver-
age
255 44
3.04
39 5.69 39
127 67
As % of total sample
17.25 -
15.29
15.29 49.80 6.20
Note: ‘Bank officials demanded undue favour’ was also given as one of choices to the farmers. But none
of the farmers had told as the reason for their exclusion from KCC loan.


